Measuring gain and phase shift of some decice doesn’t seem like a big deal, but still, how is it acutally done? Do you need fancy equipment? Or is it something of value for all designers of PLLs that don’t just want to rely on trial and error?
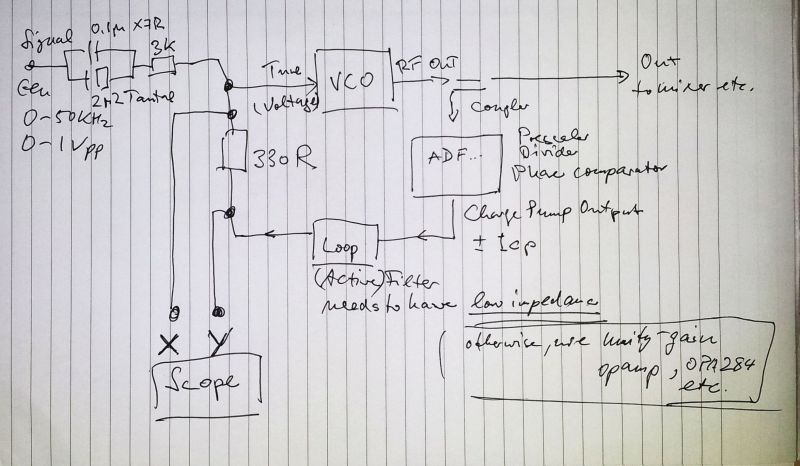
The answer – it’s actually fairly easy, and can be done in any workshop that has these items around:
(1) A simple function generator (sine), that can deliver frequencies around the band width of the PLL you are working with. Output level should be adjustable, coarse adjustment (pot) is enough. You will need about 1 Vpp max for most practical cases.
(2) A resistor, should be a considerably lower value than input impedance of the VCO. Typical VCOs might have several 10s of kOhm input impedance. Otherwise, put a unity gain opamp (e.g., OPA184) in between the resistor and the VCO tune input.
(3) A resistor, and some capacitors (depends a bit on the bandwidth), for general purposes 10-100 kHz, a parallel configuration of a 100n and 2.2 µF cap is just fine. In series with a resistor, a few kOhms. This network is used to feed a little bit of disturbance to the VCO, to see how the loop reacts to it… the whole purpose of this exercise.
(4) Make sure that the loop filter has low output impedance (opamp output). If your circuit uses a passive network as a loop filter, put in an opamp (unity gain) to provide a low output impedance.
(5) A scope, any type will do, best take one with a X-Y input.
To perform the acutal measurements, the setup is powered up, and phase lock established by adequately setting the dividers, as commonly done.
The signals (X: drive=input to the VCO, Y: response=output of the loop filter) are connected to the scope. Set the scope to XY mode, AC coupled input, and SAME scale (V/div) on X and Y.
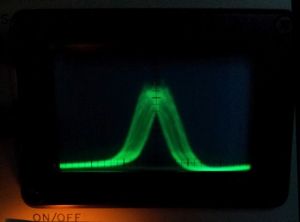
Next, set the signal gen to a frequency around the range of the expected 0 dB bandwidth (unity-gain bandwidth), and adjust the amplitude to a reasonable value (making sure that the PLL stays perfectly locked!). Amplitude should be several times larger than the background, this will make the measurements easier, and more accurate. If you have a spectrum analyzer, you can check for FM modulation. On the Micro-Tel 1295, which has a small ‘spectrum scan’ scope display, it looks like this:
On the X-Y scope display, depending on where you are with the frequency, it should show the shape of an ellipse, somewhat tilted – examples of the pattern (“Lissajous pattern”) below.
Frequency lower than 0 dB bandwidth – in other words, the loop has positive gain, therefore, Y amplitude (output) will be larger than X (input)
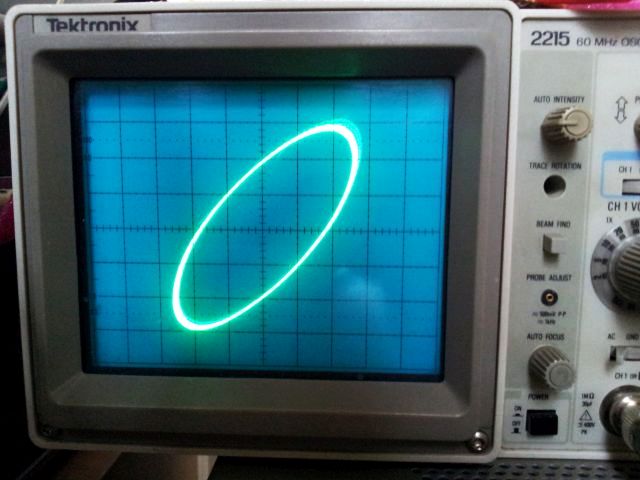
Frequency higher than 0 dB bandwidth – in other words, the loop has negative gain, therefore, Y amplitude (output) will be smaller than X (input)
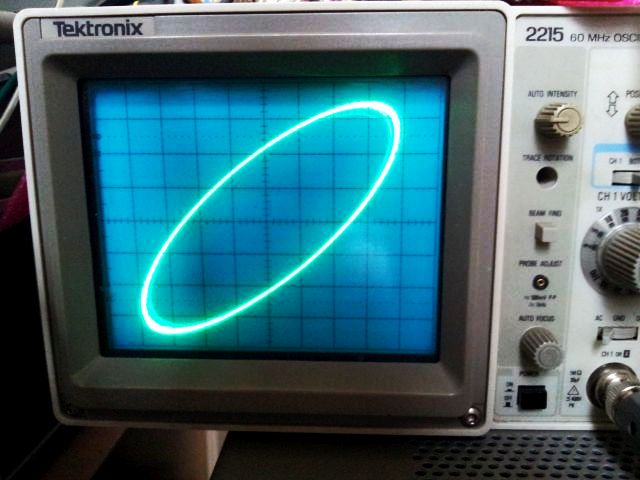
And finally, same signal amplitude in X and Y direction.
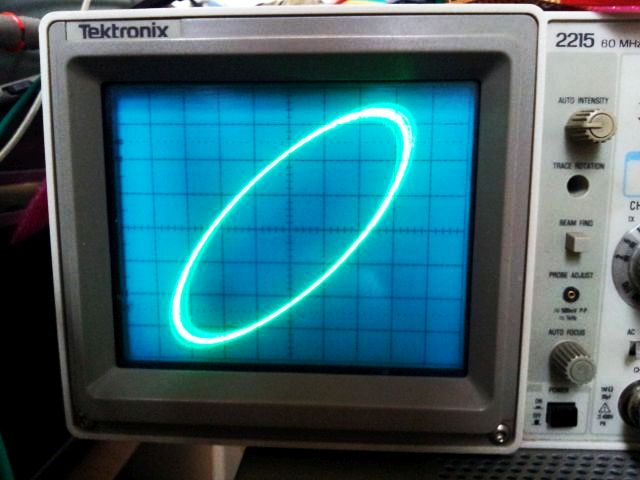
Sure enough, you don’t need to use the X-Y mode, and circular patterns – any two channel representation of the signals will do, as long as their amplitude is measured, and the frequency identified, at which X and Y have equal amplitude (on the X-Y screen, also check the graticule, because the 45 degrees angle is not so easy to judge accurately). That’s the unity gain (0 dB bandwidth) frequency we are looking for. With little effort, the frequency can be measured to about 10 Hz.
The X-Y method has the big advantage that it relies on the full signal, not just certain points, and triggering a PLL signal with a lot of noise can be an issue.
Try to keep the amplitude stable over the range of frequencies measured – by adjusting the signal gen.
Ideally, the 0 dB bandwidth is measure at various frequencies over the full band of your VCO, because the bandwidth can change with tuning sensitivity, etc., of the VCO.
The 0 dB bandwidth is not the only information that can be extracted – also the phase shift is easily accessible. Just measure, at the unity gain frequency, or any other frequency of interest for you, the length of the black and red lines:
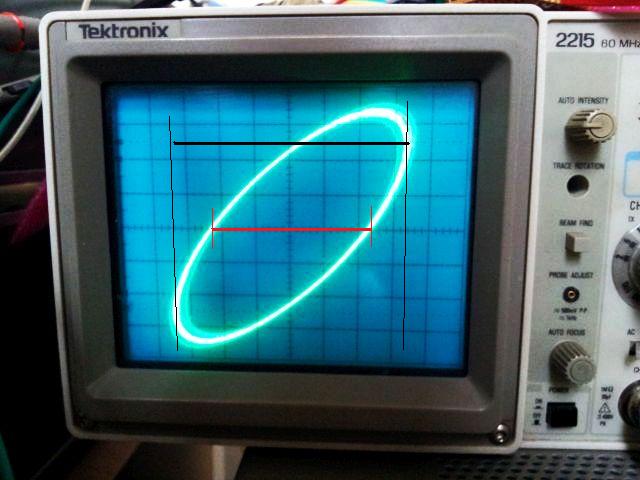
The phase angle is then calculated by: divide length of red line, by length of black line, in this case, 4.6/6.9 units. Then apply the inverse sin function, to get the phase angle, sin^-1(4.6/6.9)=41.8 degrees. The 0 dB frequency, in this case, was 330 Hz.
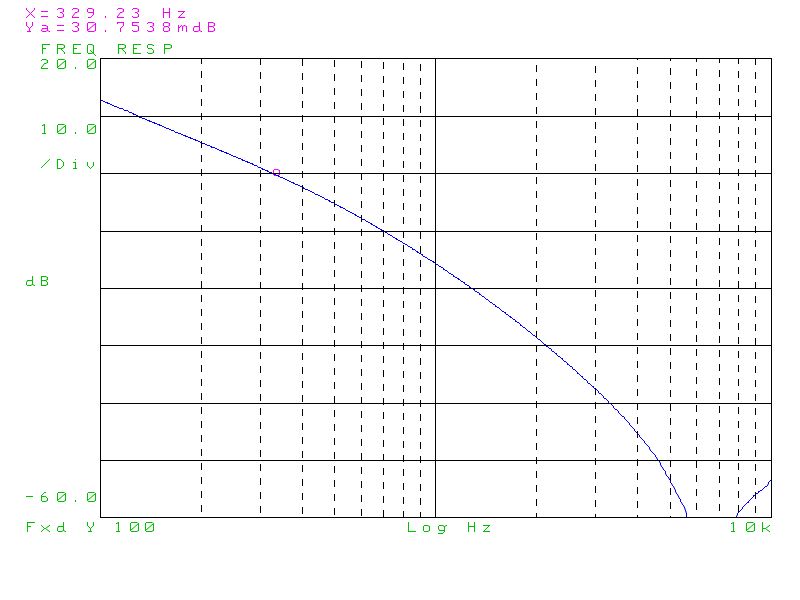
A quick comparison with the data acquired using a more sophisticated methods, a HPAK 3562A Dynamic Signal Analyzer.
Gain: 0 dB at 329 Hz – that’s close!
Phase: 38.7 degrees – fair enough.
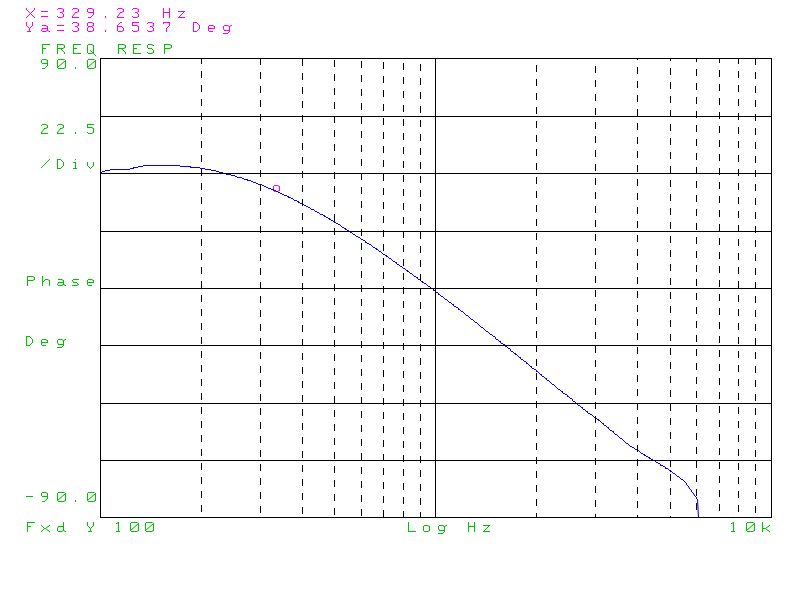
A proper PLL setup should provide at least 20 degrees of phase shift (note that this is not the so-called phase margin, which is a property of an open loop). Closer to 0 degrees, and the loop will remain stable, but a lot of noise (phase noise) and osciallation, finally, occasional loss of lock will be the result.
It’s also a good idea to check that the gain function drops off nicely – there are certain cases, where mulitiple 0 dB points exist – you need to look for the 0 dB point at the highest frequency.
Any questions, or if you need something measured, let me know.

