To further advance the ultra-linear ADC project, a little test setup has been deviced. Naturally, the final setup will require strict low noise construction, with only the best low-drift parts in the analog chain, and so on. At the moment, I just need to get to code running and tested to some kind of precision, therefore, a makeshift assembly will be good enough.
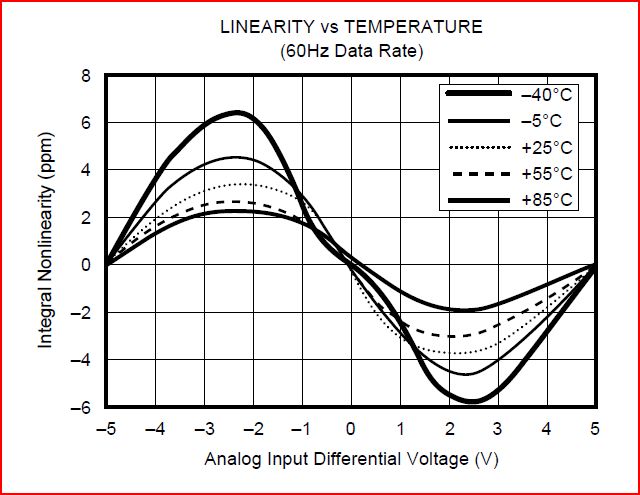
For the ADC, an Texas Instruments ADS1211 24-bit sigma-delta ADC, with a 4-channel MUX has been selected, simply because I have it around, and it has a good accuaracy to start with, about 15 ppm non-linearity, and no missing codes up to 22 bits.
A diagram from the datasheet, the non-linearity looks fairly well behaved – my confidence in hitting the 1 ppm mark is growing!
The ADS1211 is really a great part, for what it is, and for the price (about USD 25 each), and I have been using it a for a major projects in the past, 3 or 4 years ago.
The build in 2.5 V reference is not the most stable and quiet, but will do for now.
Input is configured for +-10 V bipolar, using 3.9 k-1 k Ubias resistors.
Clock frequency is 4 MHz, a sub-harmonic of the 16 MHz of the ATmega32L controlling it (again, the famouse JY-MCU board).
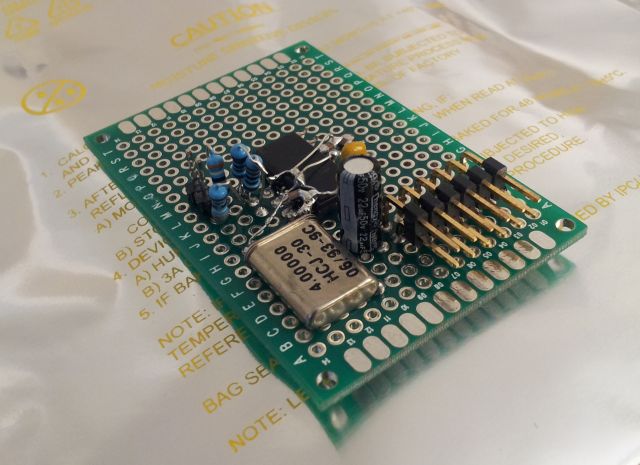
A simple trick for soldering SOIC parts to a 0.1″ pitch prototype board: just place the part on the table, upside down, and bend down, with a screwdriver, every second pin. It will be working just great, and no issue at all with soldering it, even if you don’t have good tools at hand.
No need at all for any special SMD boards, etc., just a waste of time, from my point of view.
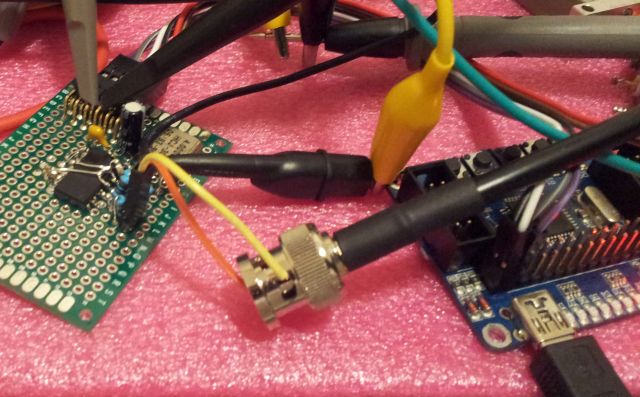
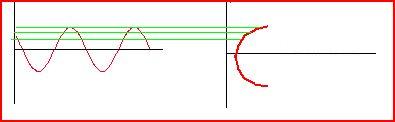
Now, for a quick test, connected a sinewave (10 Hz), and sampled at a few Hz.
More cables than actual parts.
With the sinewave at the input, and constantly sampled, the ADC output should resemble the sine function – however, we don’t want to analyze each measurement individually, but will collect massive amounts of data, and put them into bins – looking at the sine function, not all output values have the same probability – the values at the extremes will be more frequent, because there, the sine function is more flat than close to zero. No need to give the exact maths here, just a little diagram:
In the final application, we will cut-off the outer parts, and just use the middle section. For today, that’s the result of a quick test:
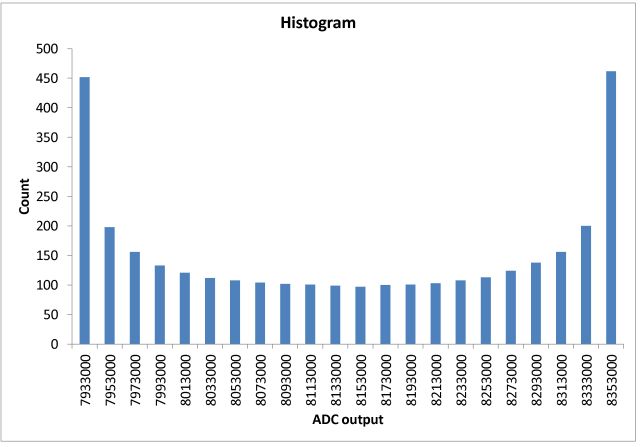
Well, quite satisfactory for a start – next step will be to figure out the details (sampling rates, data transfer protocols to avoid lost samples, fast code to sort large number of samples; also, need to find out how the local varation of nonlinearity related to the larger-scale variation – by sampling for several hours…). Will all be done, step by step.
Another idea is to measure the frequency/period of the sine test signal, and using the zero-crossing as a sync pulse, to time-stamp/calculate the acutal voltage at a given time, and correlate by a least-square of similar algorithm with the ADC digital output.